


Welcome
On this page, we made the table even more interactive.
You can now unfold a sidebar where checkboxes are waiting for you.
With these checkboxes, you can toggle the species that you want to see inside of the table.
The table is mostly the same {reactable} table as before.
The only change is that behind the scenes, a couple of JS snippets were inserted to filter the table.
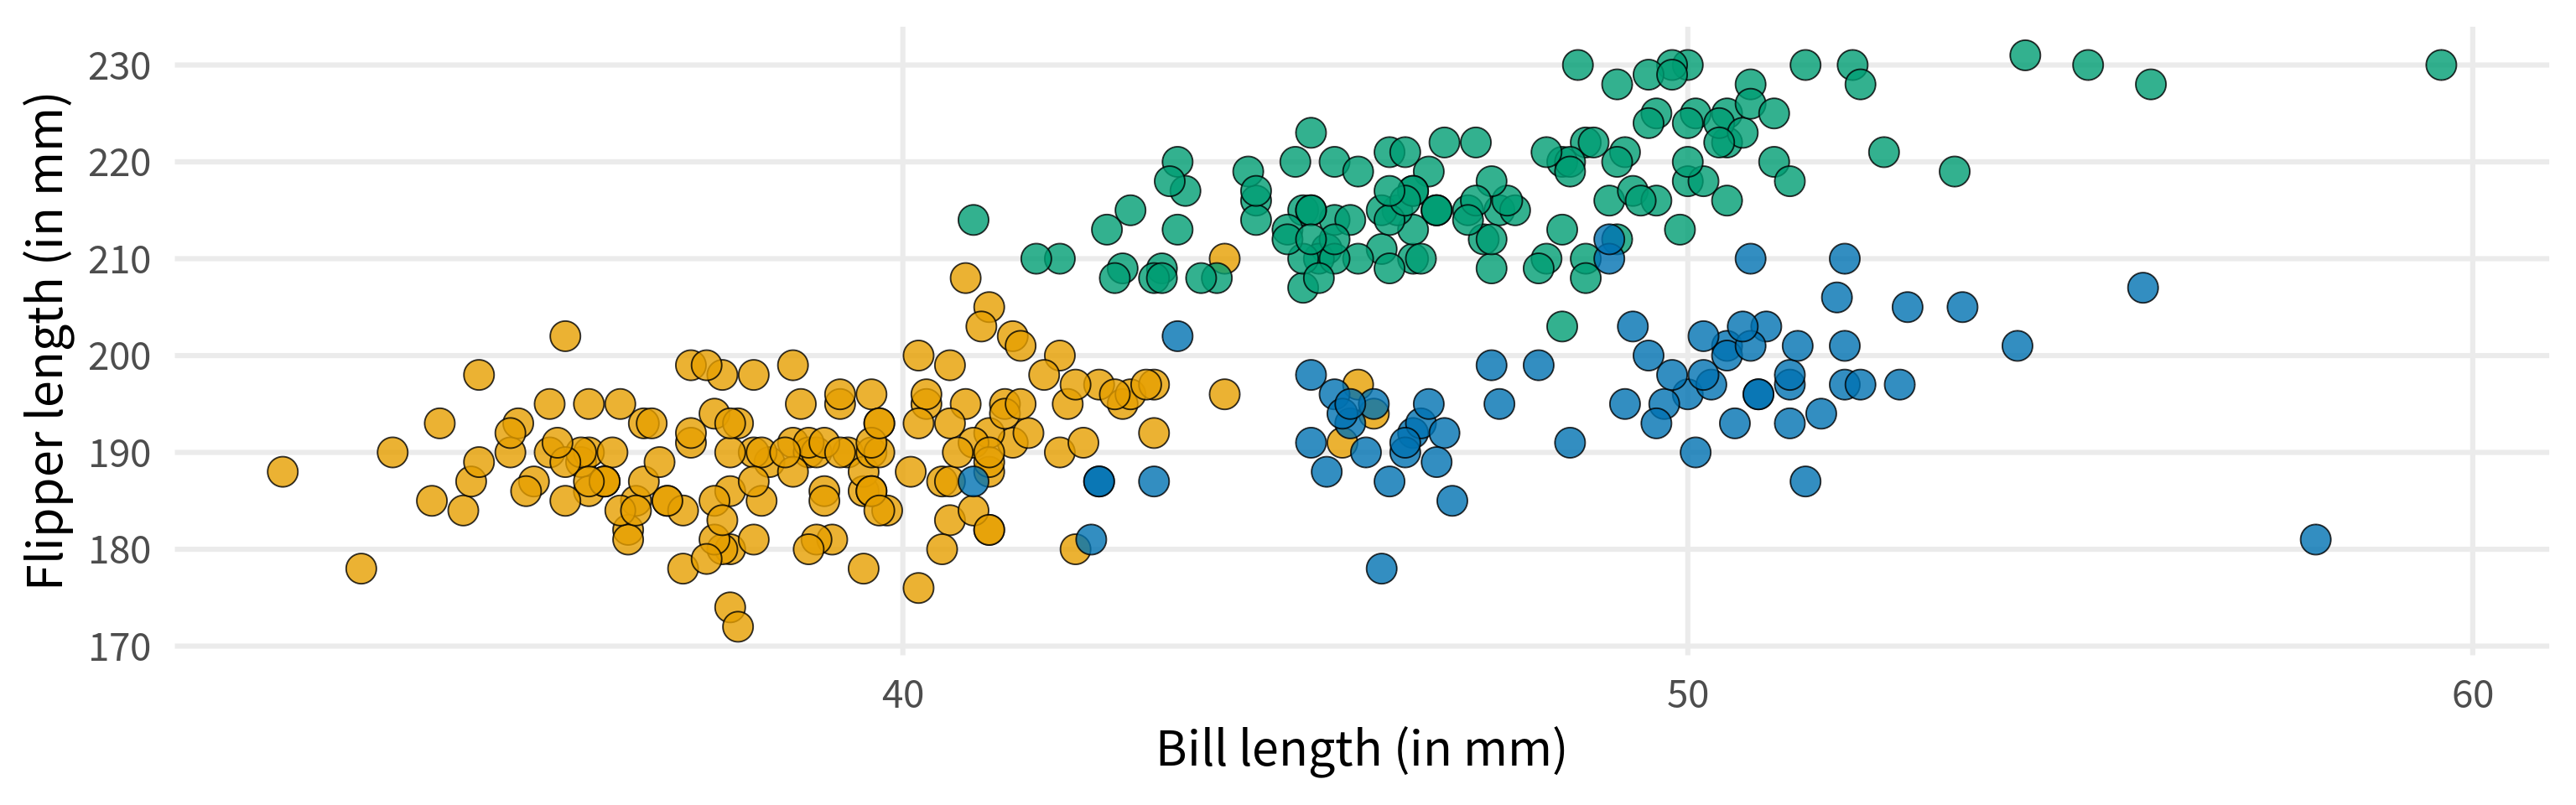
Look! Penguins data🐧😍
Look how neatly grouped the species are🟧🟩🟦